
history+
history+ offers historical weather
simulation data
for the whole world with a spatial
resolution
between 4 and 30 km, not measurement data.
These data are fully complete and without any gaps.
The worldwide data availability and completeness are unique.
Data are available for any place on Earth and on different altitude levels,
independent of weather measurement stations.
Simulation data are especially suitable for assessing weather for areas and regions over longer time periods.
Interactive graphs allow immediate access to continuous time series for your locations.
Starting in 1940, the historical weather data are available in hourly steps or daily aggregations with a spatial
resolution of 30 km, whereas higher resolution data are available since 2008 for nearly every place on Earth.
Extensive verifications of our weather models are
regularly conducted and thereby, top data quality is ensured.
history+ includes common weather variables. Other
variables
are available on request.
You can test history+ for free of charge for our home town in Switzerland
history+ for Agriculture
In this video, we discuss the importance of accurate and reliable weather data
for the segment of agriculture.
We uncover some of the history of meteoblue and its connection to the agrifood segment,
and describe how history+, one of our flagship products,
assists farmers around the world in assessing a variety of risks related to their activities.
How to get history+
- Register for free on the meteoblue website
- Go to the history+ purchase page
- Select desired number of locations
- Select payment method
- history+ is now ready to use
You buy an access contingent for a number of locations, without deciding which ones. The desired locations or
coordinates can be activated afterwards in the data download interface. history+ access remains active for 1 year,
starting at the purchase date.
You can test history+ without a subscription and explore the endless possibilities of historical weather data. The free test is limited to
Basel, Switzerland. For other locations, data for the last 2 weeks are available and can be selected with the
location search on the top of the page.
References
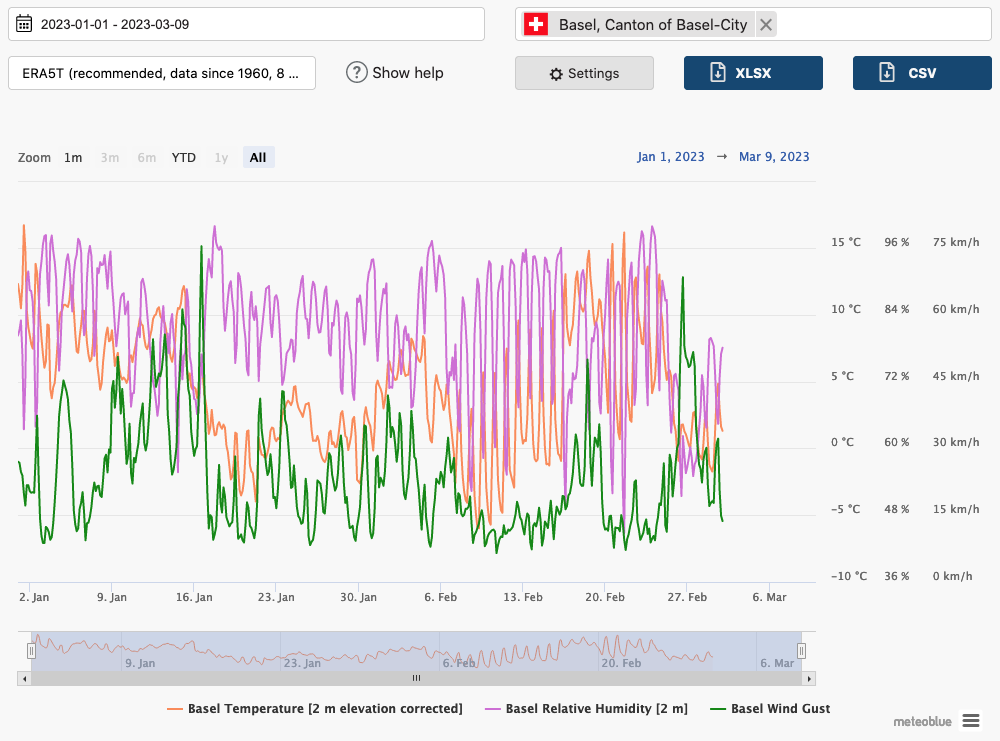
Using history+
Data download
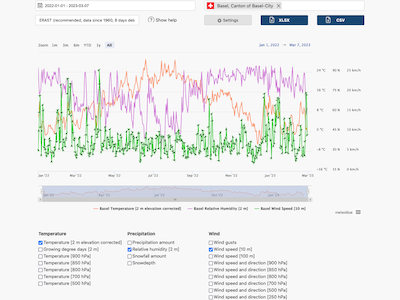
All data can be downloaded as CSV files and further processed with programs like Microsoft® Excel or OpenOffice. You can download entire time series since 1940 in hourly resolution with various parameters like temperature, precipitation, clouds or wind.
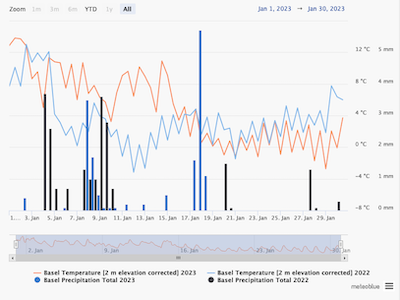
Year comparison
Visualise several seasons with accumulated precipitation or growing degree days (GDD) in one graph. See how a wet or rather hot season may affect plant development, calculate a heating sum to predict how much energy is required during winters or estimate weather conditions for a single week to plan events.
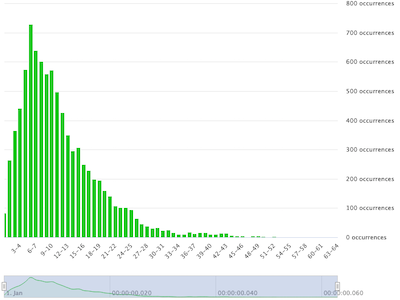
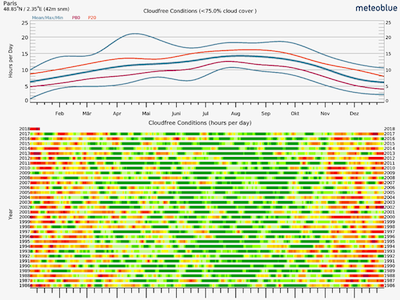
Histogram
history+ includes online analysis tools for frequency patterns. Temperature, precipitation and wind frequencies are visualised in a histogram and help to better understand occurance of conditions such as frost or intense precipitation.
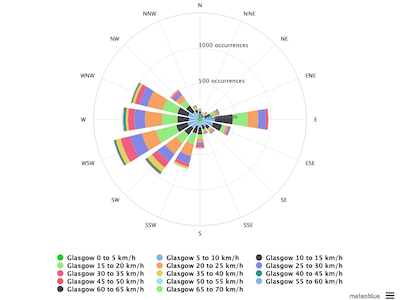
Wind rose
Wind speed frequencies for wind power generation are calculated for any coordinates on land or sea. Wind roses classify wind directions and speeds, e.g. to further evaluate potential wind park sites and improve power generation efficiency.
Risk assessment
The risk assessment tool provides an analysis of differentxw events (e.g. frost, drought or heat) over the last 40 years. By comparing different years, you can observe risk levels of specific events over time.
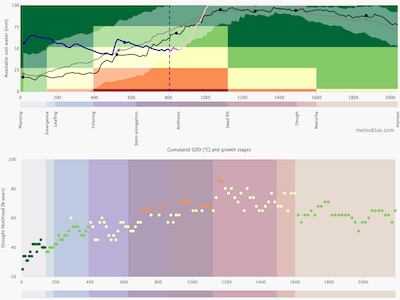
Crop risk
The crop climate risk analysis diagram shows the risks of drought, heat, or frost for a selected crop at a selected location for a chosen period in the time from 1985 to today. Crop risk prediction monitors and evaluates crop risks based on the current season weather to date, the 7-day and the seasonal forecast.
history+ use cases
You can create, print and compare historical weather data, identify and analyse frequencies, download several graphs
or historical data by using history+.
To download (or print) a graph, click on the download button (if available) below the image,
or (right-) click on the diagram, choose a file name and directory and save it. The standard
diagram format is .png.
All data can be downloaded as csv files and further processed with programs like Microsoft® Excel or OpenOffice.
You can download entire 40 year time series in hourly resolution with various weather variables like temperature,
precipitation, clouds or wind.
The practical application of our historical weather data caters to companies from a wide range of industrial sectors,
as well as scientific endeavours. Find a list of selected use cases below.
Agriculture
- Evaluation of climate-driven risks for specific field crops
- Assessment of environmental conditions and their impact on crop growth and insect development
- Historical weather data for vineyard management and yield assessment
- Yield estimation for future farming locations
- Yield gap analysis of field crops
Renewable Energies
- Renewable Energy systems management
- Solar energy yield assessment
- Wind energy forecasts
- Wind power site assessment
- Wind turbine power plant optimisation
- The weather's influence on energy consumption
Research
- The effects of air temperature conditions on the performance of power transformers
- Simulation of microclimatic conditions at pre-defined sites
- Climate conditions and their consequences for medicament storage management
- Weather simulation model calibration and verification
Precipitation & Hydrology
- Strategic flood risk assessment in remote areas
- Objective measurements of past rainfall values
- Detailed understanding of specific weather trends
- Hydrodynamic modelling of lakes - fluid dynamics simulations of water reservoirs
Air Quality
- Air pollution modelling for machine learning purposes
- Air pollution source apportionment
- Air quality numerical simulation modelling and forecasting
- Air pollution examination and investigation at industrial sites
Construction
- The weather's impact on the usage of tower and crawler cranes in large-scale construction projects
- Weather conditions and their impact on the design of greenhouses
Environment
- Research of exposure to pesticides due to environmental conditions
- Dustfall monitoring and reporting at mining industry sites
Outdoor & Sports
- Statistical analysis of the frequency of days suitable for outdoor activities in mountain areas
- Feasibility study of artificial snowmaking in the Himalayas