Relevant links
Features
Technical documentation
More free offers
- Optimise your site selection and site assessment
- Compare different locations with solar maps or raw data
- Hourly time series from 80 years of global weather simulations
- Horizontal irradiation (GHI) and other variables within high precision tools
- Numerous variables worldwide to your specific site as a database to your own country
You need raw data for software implementation, additional variables or countrywide database? We offer a wide range of products for solar energy - site search.
Weather APIs
Maps API Fully customisable integration of our stunning weather maps
meteoblue delivers a range of weather map layers that integrate seamlessly into your energy management system.
All maps are available through the meteoblue API and on the meteoblue website. The meteoblue API delivers the maps as graphics in PNG format for placing onto an existing map (for example Google Maps).
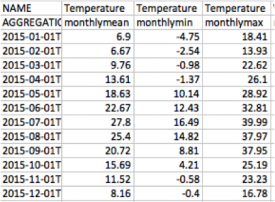
History API Our recommended solution to integrate weather data in your application
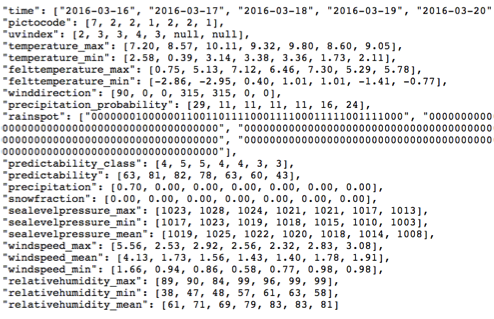
The History API delivers raw data as hourly, daily, or monthly time series or TMY (typical meteorological year) since 1940 with a spatial resolution of 30 km for the following variables:
- Solar radiation
- PV yield
- Sunshine
- Cloud cover
- Temperature and dew point temperature
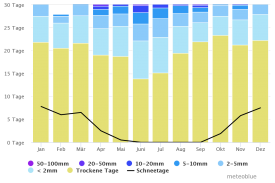
Image API Ready to use weather and climate diagrams
meteoblue offers thousands of images from different categories, that can easily be integrated. These images can be individually customised as they are available in many languages for any location on Earth.
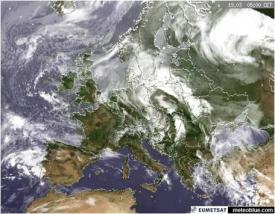
Dataset API The big data API for complex analyses of historical weather data
To assure the highest quality level of your required radiation data we can compare satellite observed radiation data with other datasets like ERA5 reanalyses or weather models. The different datasets can be used to assess typical and extreme years and optimise long term yield.
history+
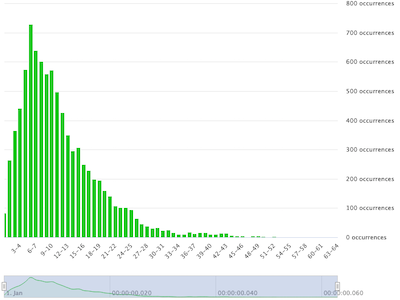
Histogram
history+ includes online analysis tools for frequency patterns. Temperature, precipitation and wind frequencies are visualised in a histogram and help to better understand occurance of conditions such as frost or intense precipitation.
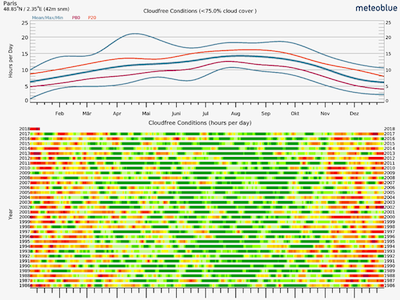
Risk assessment
The risk assessment tool provides an analysis of differentxw events (e.g. frost, drought or heat) over the last 40 years. By comparing different years, you can observe risk levels of specific events over time.
Transmission
How to order?
For pricing examples, detailed information on the access levels, meteoblue credits, support levels and license conditions please consult our API pricing page.

If you have any questions or need advice, please get in touch. Our expert on renewable energy systems will get back to you shortly.
Stefan Bohren
Key Account Manager


