Heat maps
The identification of local heat islands in the city helps city planners to coordinate mitigation actions at the right location, and citizens to identify more comfortable areas of the city.
- Horizontal resolution of 10 x 10 m
- Urban and rural areas are covered in the pre-defined city domain
- Heat maps are calculated for day/night and summer/winter situations
- Map of local climate zones (LCZ) and analysis of temperature differences for each LCZ
- Data offered in the form of maps, plots and raw data in CSV and NetCDF format
The ongoing climate change leads to heat accumulation, especially in cities. Therefore, cities are more exposed to climate change than the surrounding rural areas. This leads to an increasing number of tropical nights and heat days in cities. Heat waves will increase in frequency and duration in the future, leading to an unknown increase in economic damage, and will endanger the health and lives of the cities’ populations.
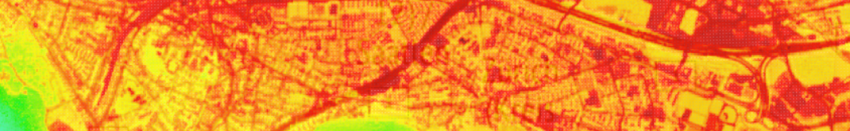
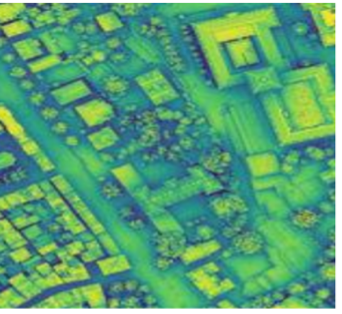
Based on satellite images, measurements, and modelled air temperature data in the city and surrounding areas, so-called “heat maps” are calculated. They have the horizontal resolution of 10 x 10 m and are used to detect and visualise the urban heat island effect. The heat maps can therefore be used as an urban planning tool for site-specific mitigation measures, with the aim of reducing the urban heat island effect. The reduction of the urban heat island effect by mitigation measures (de-sealing of surfaces, greening, watering and more) can only be implemented in a cost-effective way if the heat accumulation of site-specific locations is known. Therefore, heat maps serve as a decision-making aid for urban planners in their strategies to reduce the urban heat island effect.
The meteoblue heat maps can be produced for any city or town in the world, and to visualise the urban heat island in simple maps, tables, and raw data. They include the following elements:
Heat map elements
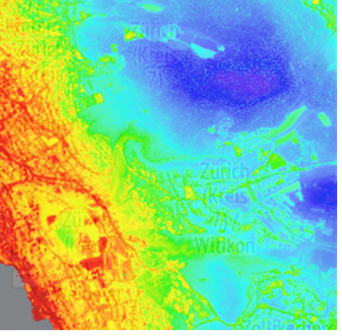
Urban Heat Islands
The urban heat island effect is a typical phenomenon of the climate of a city. It is defined by an air temperature difference between the heat-exposed city centre and the cooler surrounding rural areas.
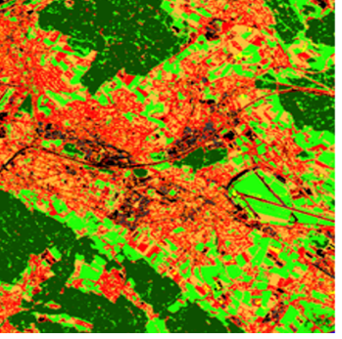
Local Climate Zones (LCZ)
meteoblue provides local climate zone maps for any city in the world. A climate zone map is generated from satellite images with a horizontal resolution of 10m.
Scientific documentation
Our basis for developing high resolution temperature maps to resolve the urban heat island effect is based on artificial intelligence developed within several years of proprietary research.
