Validation of mitigation strategies
The validation of climate change mitigation strategies is part of the decision chain and enables an important feedback loop for cities to plan, prioritise and execute their mitigation measures. Continuous monitoring is required to detect new trends, and to analyse how the climate of the city is changing.
- Discover our validation process – comparing weather data from before and after the implementation of the adaptation measures
- Case study: Triangle area in Basel, Switzerland
The increase in air temperature, caused by climate change, has a harsher impact on cities than on their rural surroundings. The average air temperature in cities is at least 2°C higher than in their vicinity. Therefore, any additional future temperature increase brought about by climate change will likely have severe consequences for cities.
After the city has decided which climate change adaptation measures are the most suitable and most efficient, the implementation follows. Usually, meteoblue proposes at least 4 climate adaptation measures at selected locations within the city, depending on the city’s decision.
At least 6 months (preferably 12 months) before a city implements the measures, the measuring stations are installed at pre-defined locations, where the measures will take place, and in their surroundings (if there are no measurement stations available yet), according to a placement plan. These stations collect data continuously from before to after the implementation of the measures. These measurements are used in a statistical analysis to validate the climate change adaptations. Within 6 months after completion of the adaptation measure, the first validation analyses will take place which enables city planners to monitor the effect of the adaptation strategies, detect new trends and analyse how the climate of the city is changing.
An example: Triangle area in Basel, CH
This report tests de-sealing as an adaptation measure to climate change. For this purpose, the so-called Triangle area in the Swiss city of Basel (in the Erlenmatt quarter, near Badischer Bahnhof) was studied.
A large sealed area was de-sealed and covered with gravel and planted with 18 small trees. These will continue to grow in the coming years, creating a greener environment in the area (figure below).
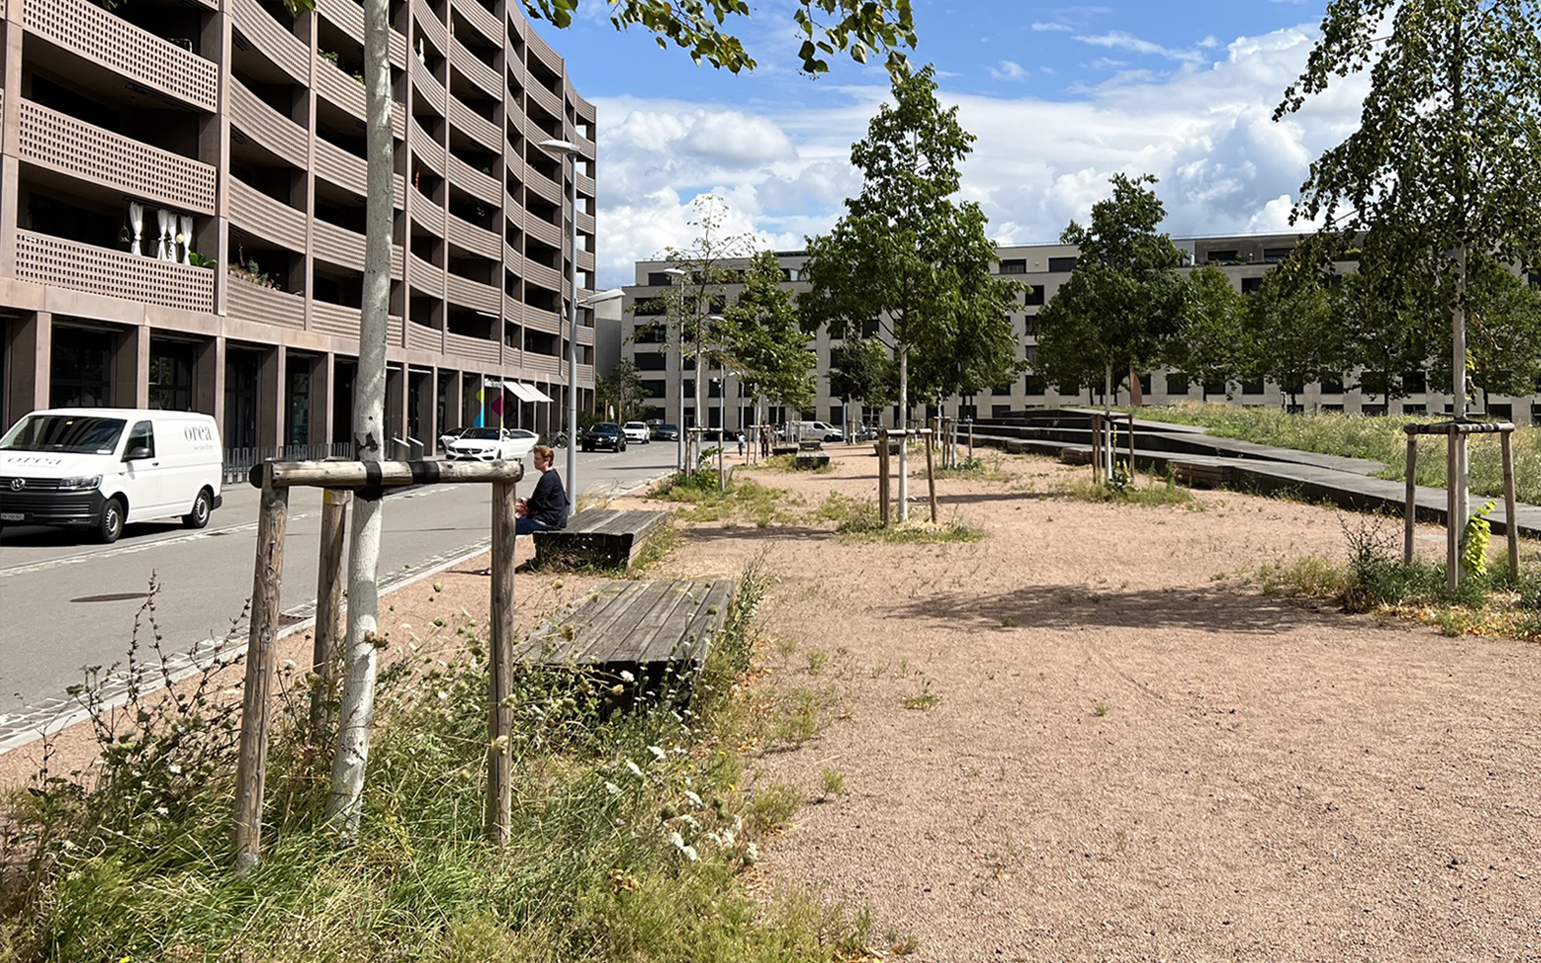
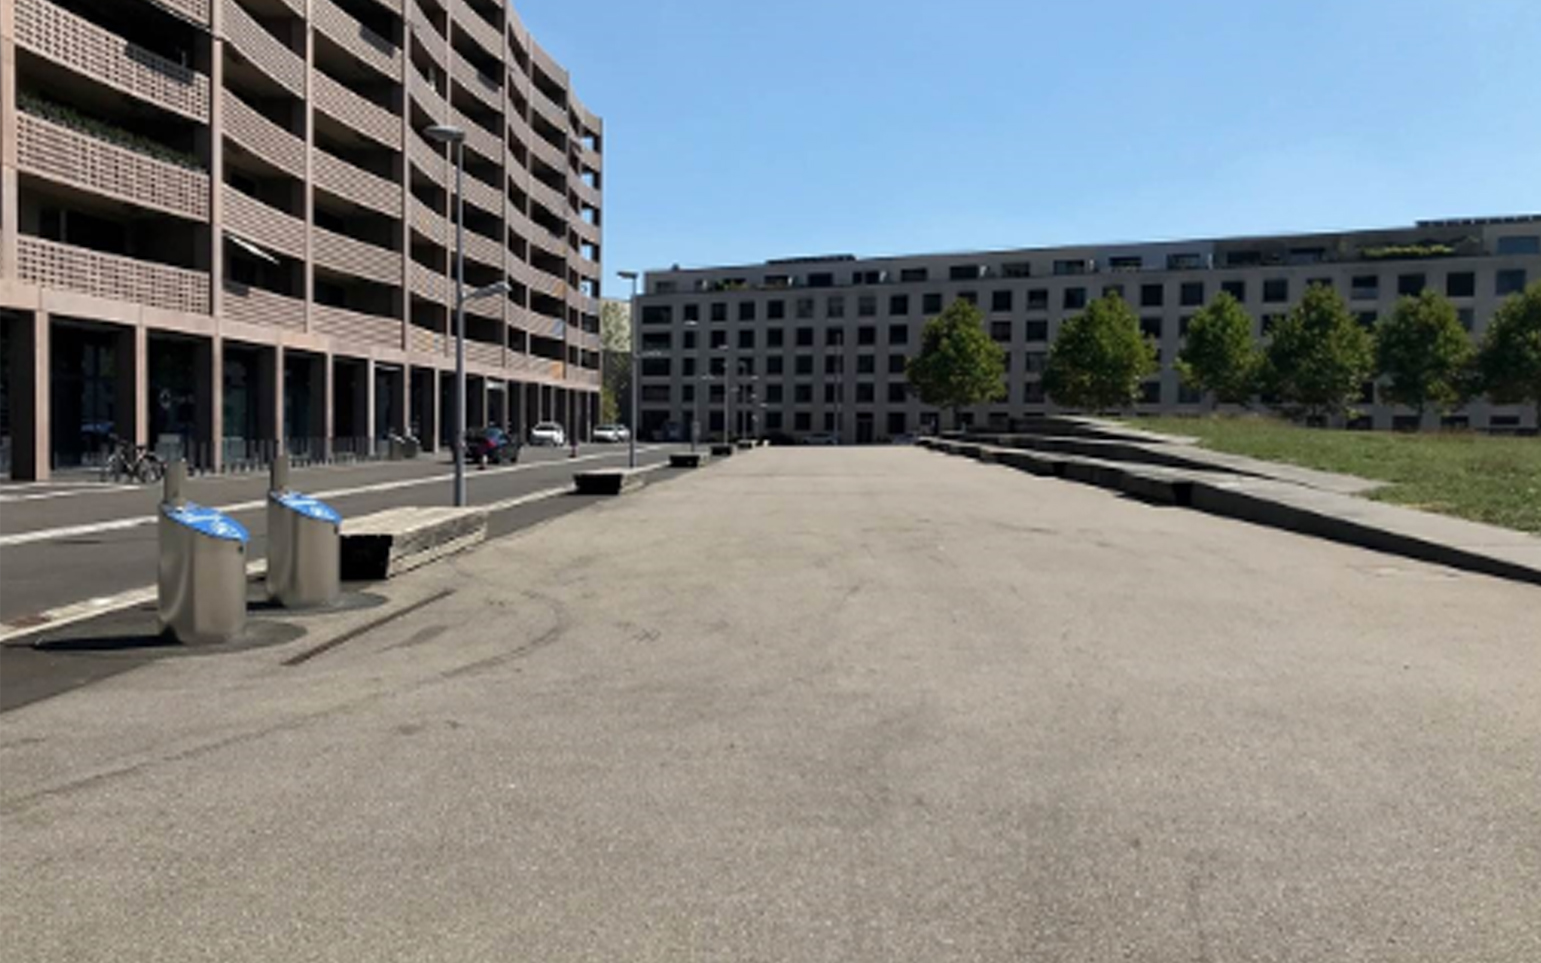
Triangle area before the adaption measures (left) and after (right)
The dense IoT measurement network in Basel was used to detect small changes in the air temperature, as compared to the environment (without adaptation measures). In order to detect small differences in air temperatures in the Triangle area, three sensors were installed in the area three months prior to the start of the renovation works. In addition, reference 12 sensors in the vicinity were used for comparison (figure below). The average values of the three sensors in the Triangle area and the 12 sensors in the reference area were used for comparison.
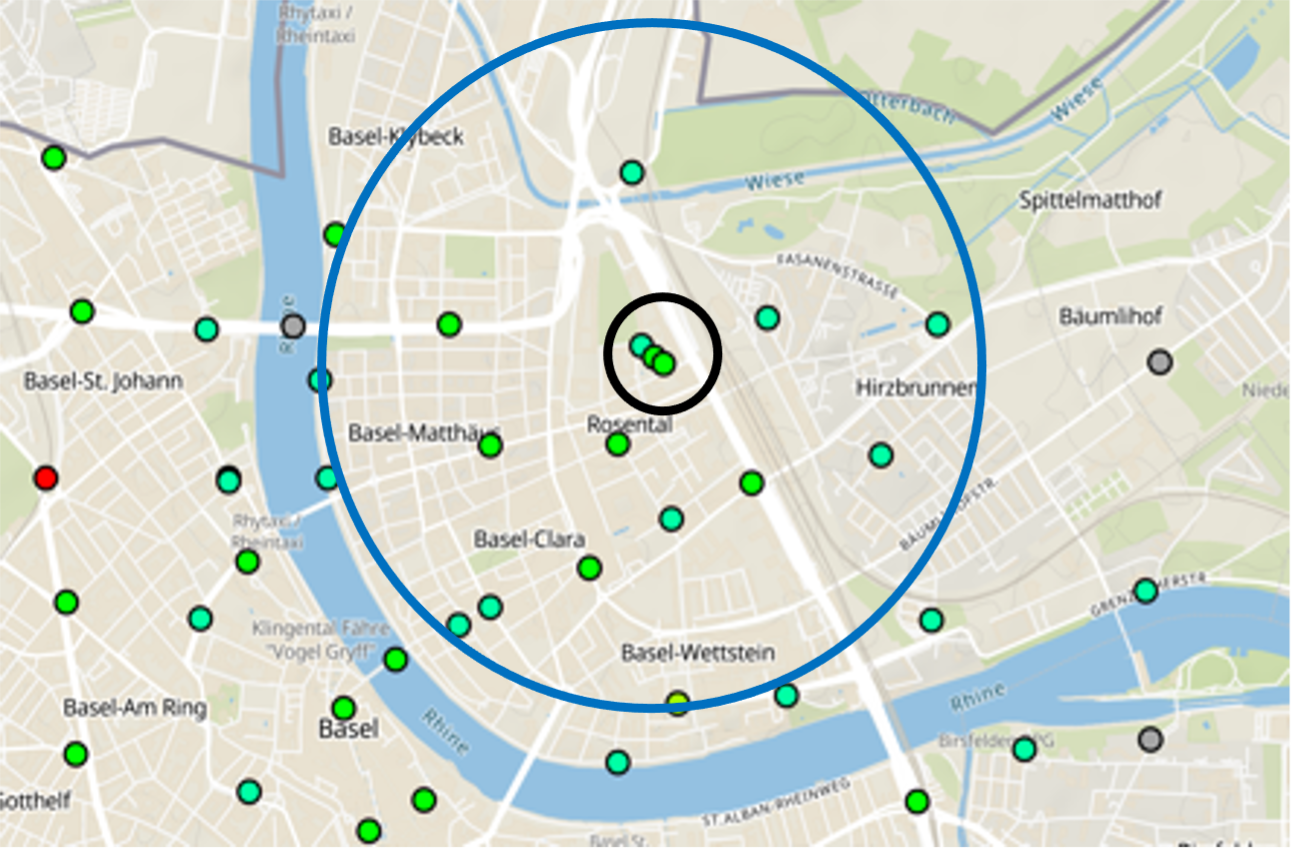
Location of the measurement stations within the Triangle Area
Locations of the meteorological stations in the Triangle area (three stations within the black circle) and in the reference area (12 stations inside the blue circle) around.
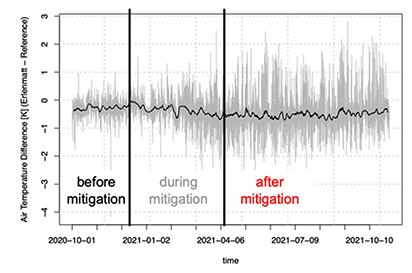
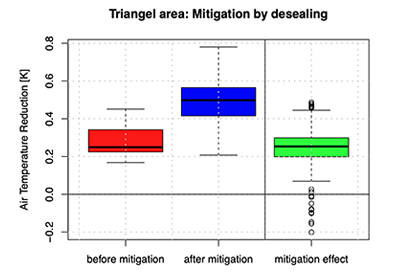
The next figure on the bottom left shows the air temperature difference (Triangle area – reference area) before, during and after the implementation of mitigation action (on the left side). Before adaptation, the differences between the Triangle area and the surrounding area were on average - 0.3°C, meaning the surrounding area was warmer than the Triangle area. After the implementation of the adaptation measure, the differences between the triangle area and the surrounding area are 0.6°C less than 0. Therefore, the Triangle area has a 0.3°C cooling effect due to the implementation of the adaptation measure.