
Manuel Damsohn
Director of Product Innovation
Pexapark

Relevant links
Features
Technical documentation
More free offers
With globally consistent, high quality weather data, you can ensure optimal scheduling, yield estimation and maximum yields.
meteoblue offers thousands of images from different categories, that can easily be integrated into your SCADA software. These images can be individually customised as they are available in many languages for any location on Earth.
meteoblue offers various layers of weather maps that can easily be integrated into your SCADA software.
All maps are available through the meteoblue API and on the meteoblue website. The meteoblue API delivers the maps as graphics in PNG format for placing onto an existing map (for example Google Maps).
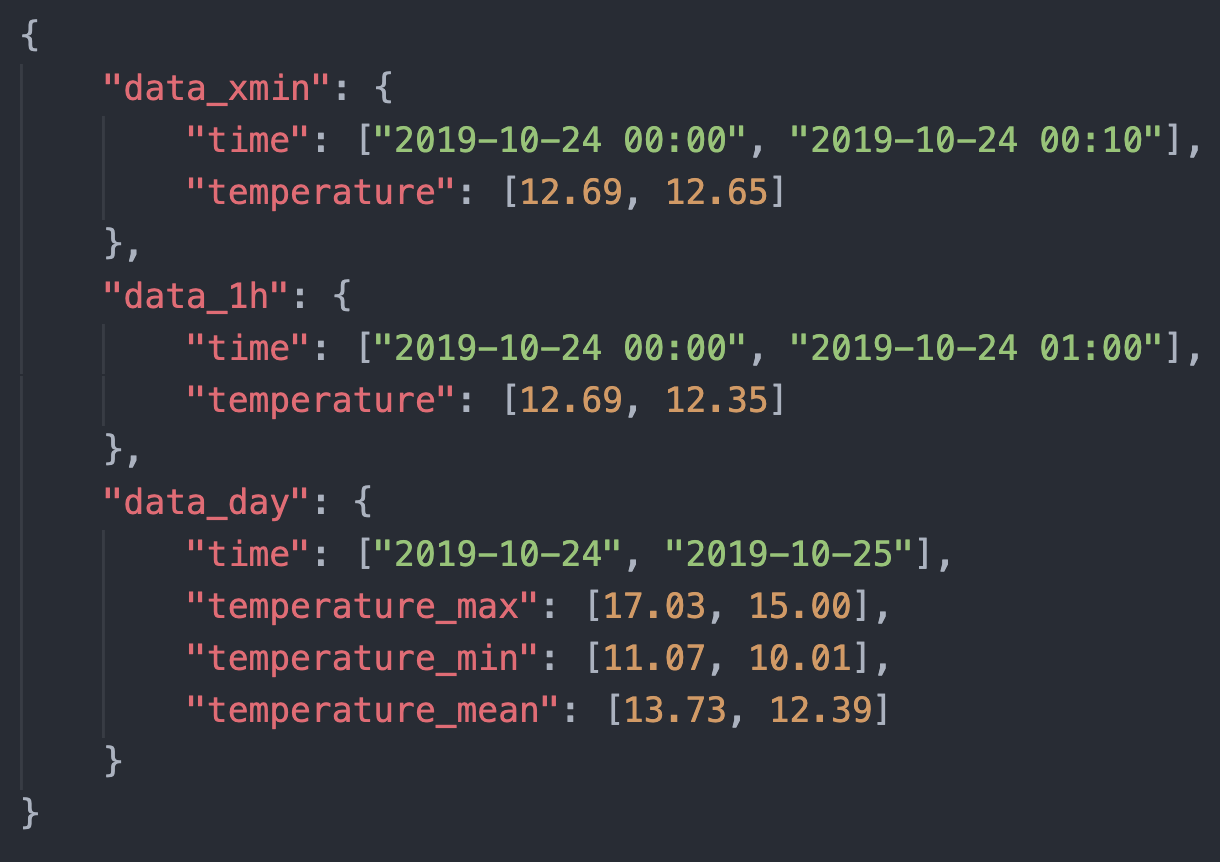
meteoblue offers numerous weather variables as forecast packages and through the History API. Forecast data relevant for wind energy are available in CSV and JSON formats, historical data can be accessed through easy to integrate calls to our high-speed API.

meteoblue offers a wide range of different meteograms, that give an overview of the general or specific weather of the next days. These are especially useful to optimise the timing of maintenance activities.
For the wind energy sector we recommend the following meteograms:
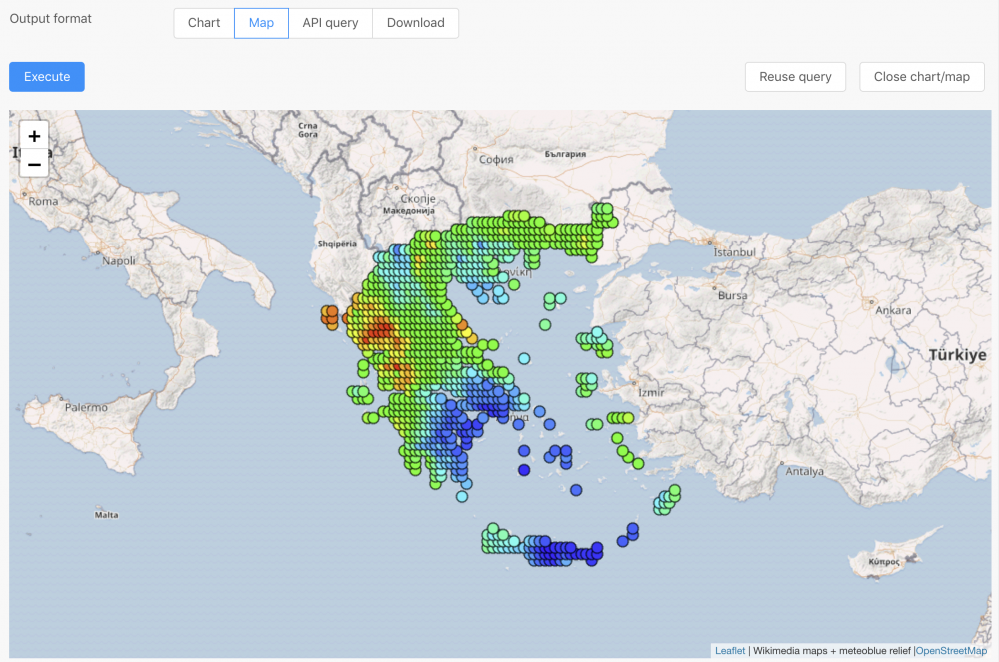
The Dataset API gives access to the world largest weather database with more than 50 different datasets and hundreds of variables. Climate predictions and site comparisons based on typical and extreme years provide help in securing long term investments.

Manuel Damsohn
Director of Product Innovation
Pexapark

MOS (Model output statistics) is the technique of post-processing the output from numerical weather forecast models using statistics of local historical power measurements. The MOS service substantially improves the accuracy of the forecast data for wind speed and power predictions. Site specific conditions like local wind fields, wake and other local effects are accurately forecasted when wind energy MOS is implemented.
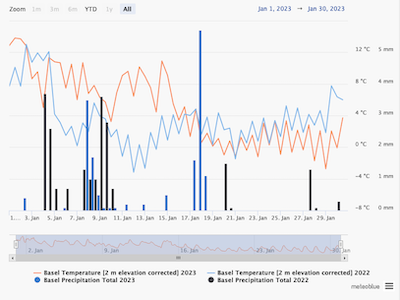
Visualise several seasons with accumulated precipitation or growing degree days (GDD) in one graph. See how a wet or rather hot season may affect plant development, calculate a heating sum to predict how much energy is required during winters or estimate weather conditions for a single week to plan events.
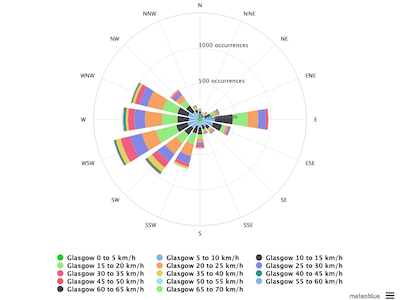
Wind speed frequencies for wind power generation are calculated for any coordinates on land or sea. Wind roses classify wind directions and speeds, e.g. to further evaluate potential wind park sites and improve power generation efficiency.
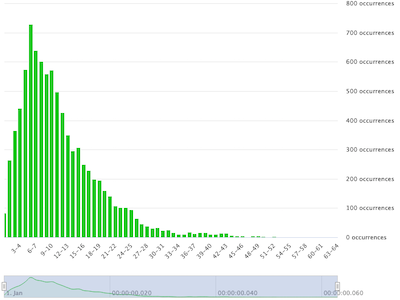
history+ includes online analysis tools for frequency patterns. Temperature, precipitation and wind frequencies are visualised in a histogram and help to better understand occurance of conditions such as frost or intense precipitation.
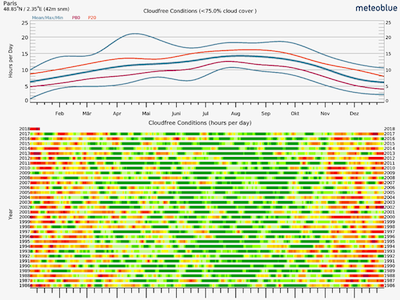
The risk assessment tool provides an analysis of differentxw events (e.g. frost, drought or heat) over the last 40 years. By comparing different years, you can observe risk levels of specific events over time.
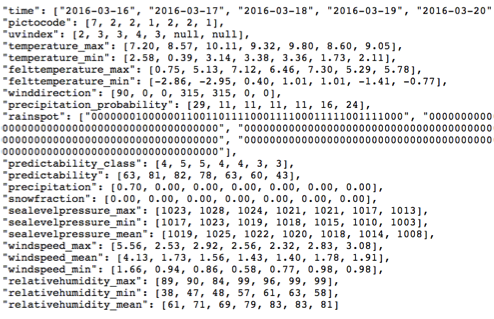
For pricing examples, detailed information on the access levels, meteoblue credits, support levels and license conditions please consult our API pricing page.

If you have any questions or need advice, please get in touch. Our expert on renewable energy systems will get back to you shortly.
Michael Bührer
Head of Weather Services


